
Analytics
See how your time is being booked
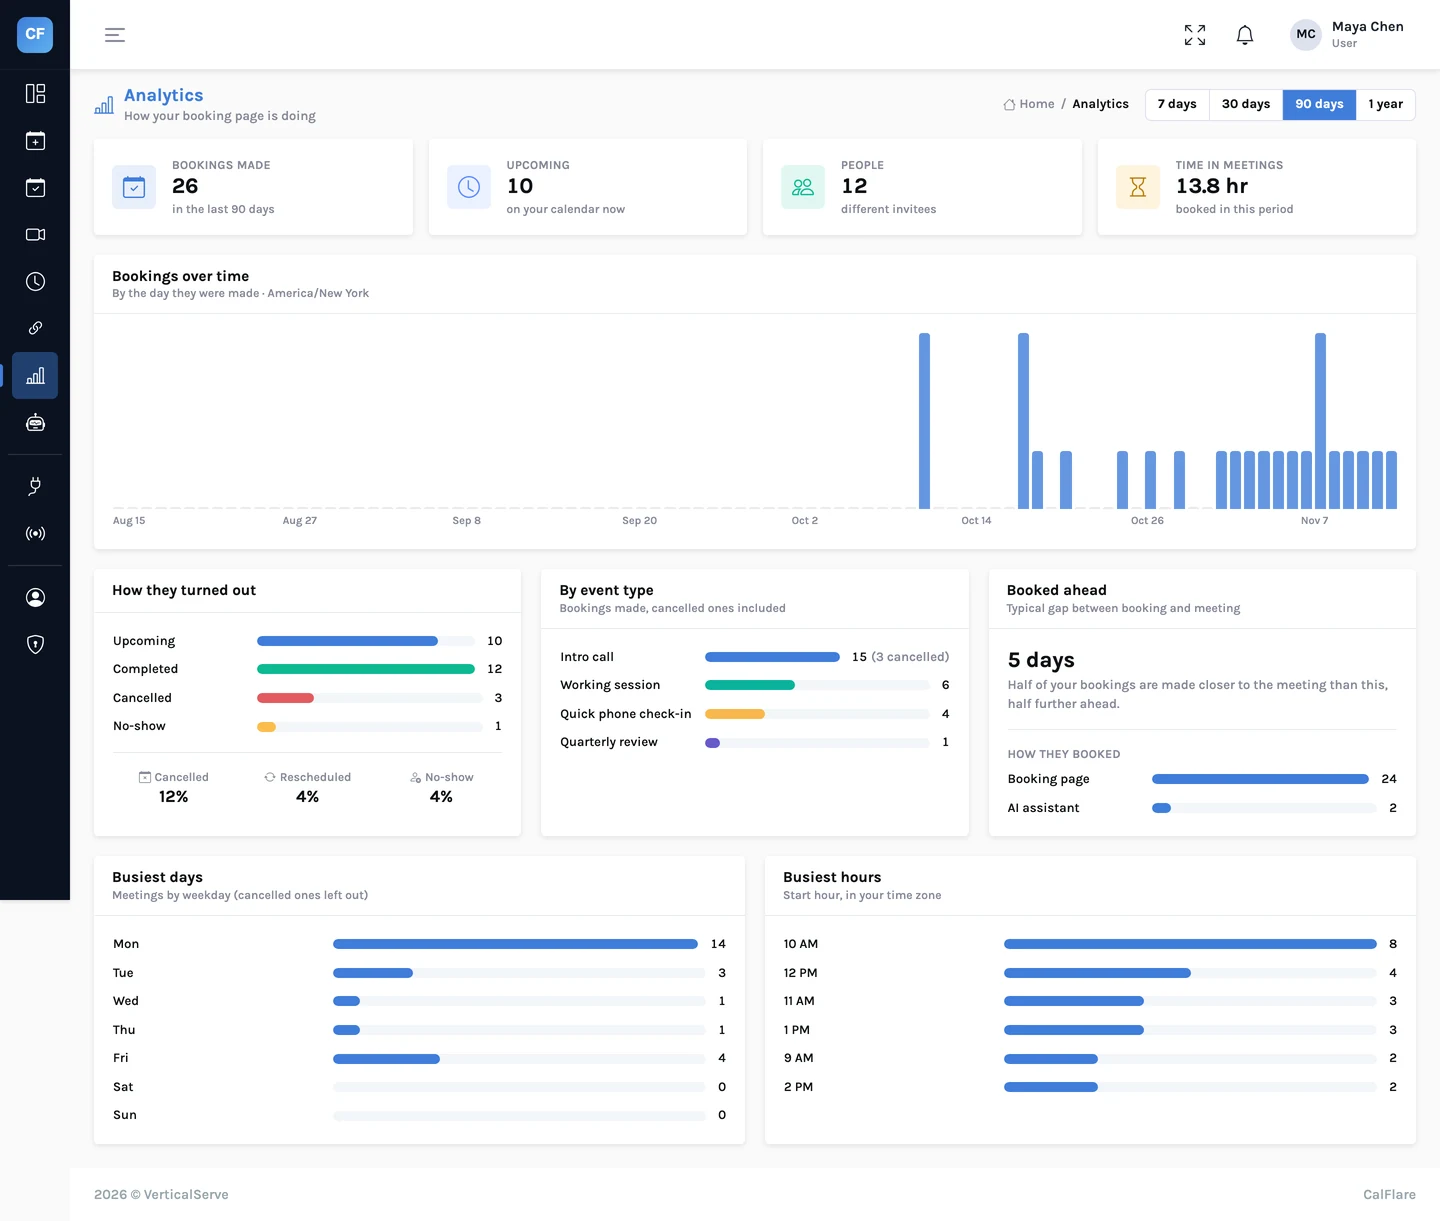
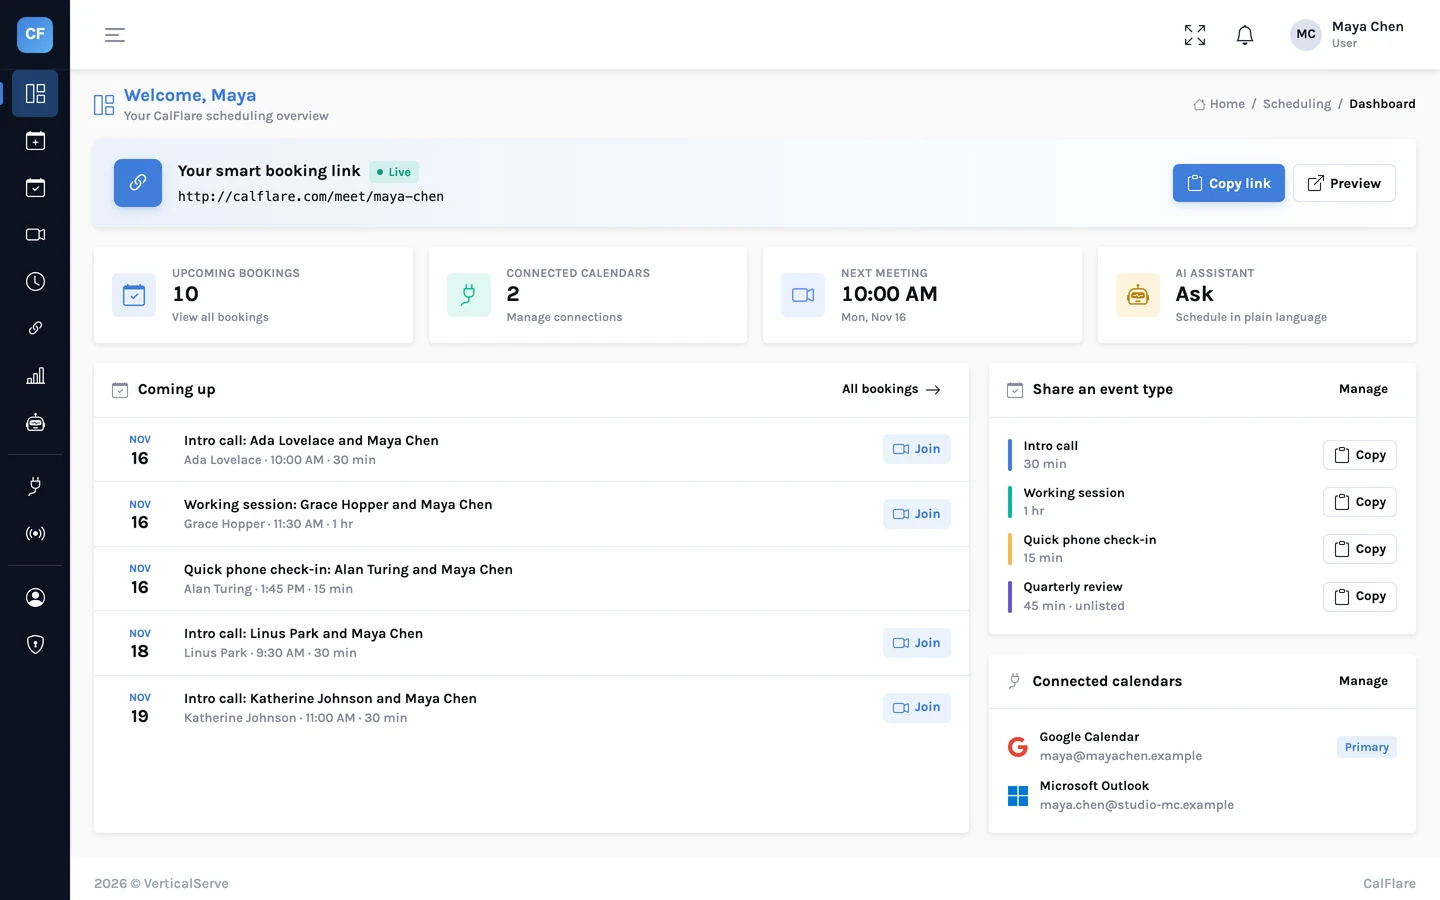
A booking link runs without you. Analytics show what it has been doing: how many meetings, which kinds, when, and how many did not happen.
Overview
Counts, rates and a trend
Bookings over time, with counts for upcoming, completed, cancelled and no-show meetings and the rate for each. The reschedule rate shows how often plans move.
- Upcoming, completed, cancelled, no-show
- Cancellation, no-show and reschedule rates
- Bookings over time
Patterns
When people book, and what
See your busiest weekdays and hours, and a breakdown by event type. Median lead time tells you how far ahead people usually book. Hours in meetings adds it all up.
- Busiest weekdays and hours
- By event type
- Median lead time and hours in meetings
Export
Take the data with you
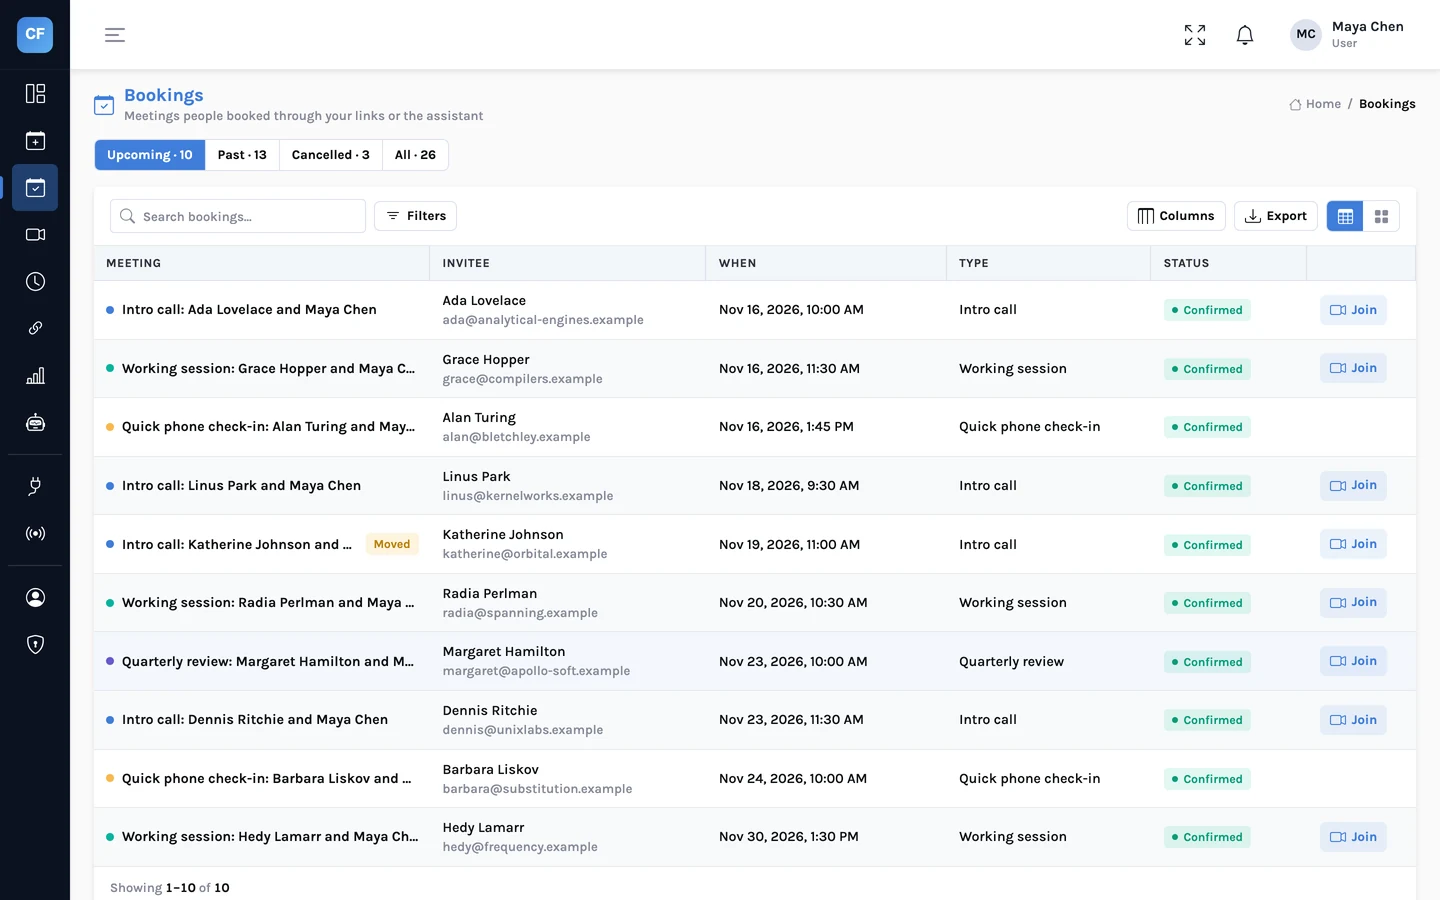
Export your bookings to CSV and open them in a spreadsheet, or load them into whatever you report from.
- One CSV of bookings
- Works with any spreadsheet
- For live updates, use webhooks
The details
What is measured
- Volume
- Bookings over time.
- Outcomes
- Upcoming, completed, cancelled and no-show: counts and rates.
- Changes
- Reschedule rate.
- Timing
- Busiest weekdays and hours; median lead time.
- Mix
- Bookings by event type.
- Load
- Hours in meetings.
- Export
- Bookings to CSV.
- Scope
- Your own bookings. There are no team reports, because there is no team scheduling yet.
Share one link. Let people pick a time.
Connect a calendar, set your hours, and send your booking link. CalFlare is free to get started.